Building Looker dashboards to make informed product decisions
At Addepar, I work on the Reporting product for financial advisors and wealth managers. Our client base contains multiple user personas from multiple different types of financial institutions (private banks, family offices, institutions). In order to create the best possible experience that is scalable and future-proof, it is not only important to understand how users use the product, but also important to know what types of users are using the product a certain way.
In a data role, it is also critical to acquire industry knowledge in order to make the right conclusions. Some examples from my work include:
- Client type: Filtering out data from institutions (large end-client base) while looking for data for a new feature in a product area that is primarily intended for smaller banks and family offices.
- User persona: Some users have a defined role in using the product; they will never touch some parts of the software. For example, advisor associates create end-client reports, but they will usually not take care of permissioning and access, which is the job of an operations specialist. While looking at the data for a certain user persona, it is important to keep this in mind since it may heavily influence the user activity data being shown.
- Reporting season: In Q3 and Q4, the number of reports generated by financial advisors usually increases by 2-3x compared to Q1 and Q2. It is important to take this into account while looking at user activity.
- Team vs user breakdown: It is very common for large banks and enterprise clients to have multiple different teams—providing services to different clients—under the same production environment. Since Addepar offers team (and team permissions) functionality, it is important to look at metrics in terms of both team usage and overall firm usage.
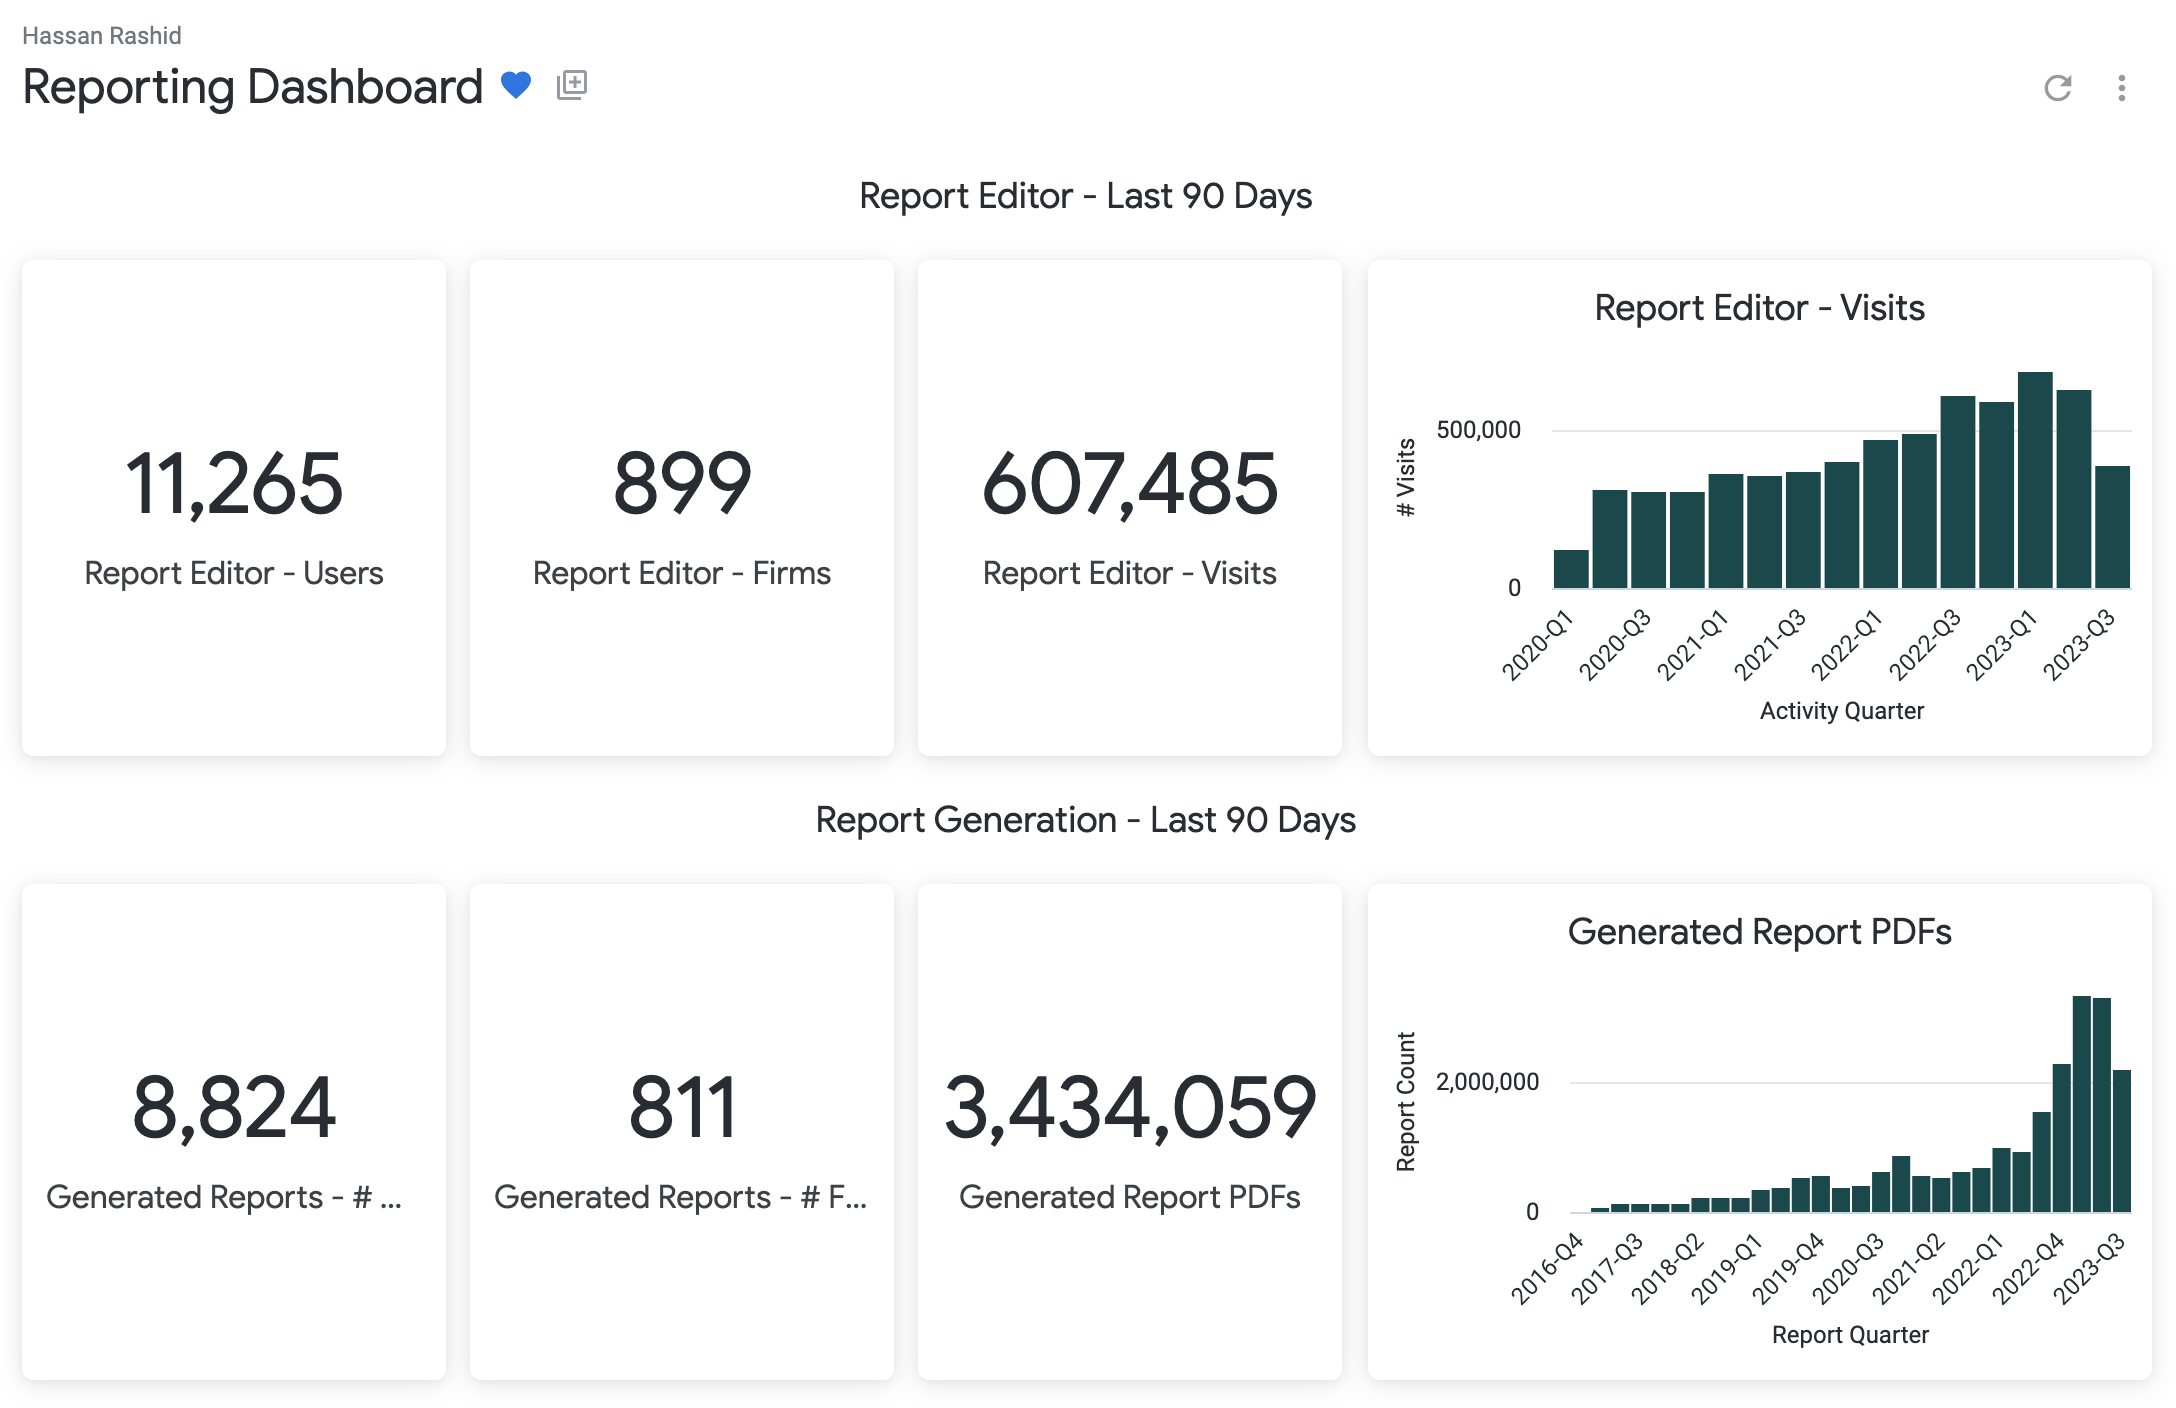
In my work at Addepar, I have used Looker to build multiple dashboards and separate “Looks” (Views) to help my team and the company understand how the Reporting product is used at scale, by different user personas.
I created the first ever company-wide Files Usage Looker dashboard that saved the Product team ~10 hours per week
The dashboards and visualizations I created (below) saved the product team roughly 2 hours per feature developed since no ad-hoc analytics requests had to be submitted, nor any SQL or Snowflake pipelines updated.
Situation
The Files product at Addepar has been around for a long time, but there has never been any meaningful tracking of how clients use the feature. The goal of the Files Usage dashboard was to present clear stats to the Product leadership team and any other stakeholders so they can decide what improvements need to be made.
My Responsibilities & What I Did
My main task was to build an easy-to-understand Looker dashboard for the Files product at Addepar that provided a clear distinction between the total number of files and folders created by users, and the total number of generated PDFs created by users. I also made sure to include both user personas in the dashboard: advisors and their end-clients.
I first created an initial list of what metrics might be useful in a Files usage dashboard:
- Total number of files
- Number of files uploaded by advisor
- Number of files uploaded by end-client
- Number of files that are generated reports
- Total file size
- Number of folders per firm
- Folders usage over time


The Files Usage dashboard provides insights into how clients utilize files and folders functionality within Addepar.
It can be seen that client #1 is skewing results due to their extremely high usage of folders. For some products/features, this may be a positive result and/or just an innocent indication of the client's size. However, it may also unveil client pain points—why do they have to create so many folders? Can the same result be accomplished in another way?
Results
This dashboard helped the Product team understand how clients were using folders—it was found that multiple enterprise clients were following a manual workflow to create hundreds of folders and sub-folders in order to store client data (for example, by year → quarter → month) since Addepar didn't offer bulk folder creation functionality. The recommendation for the Product team was to introduce an automated workflow for clients to create folders and sub-folders based on the year, quarter, and the month. Ultimately, this would help save time for clients and let them focus more on building better Reporting solutions for them.
Other Dashboards

Note: Firm IDs removed to protect PII