Building Tableau dashboards to analyze sales metrics and KPIs based on real-world data—approach & best practices
Situation
Data sets:
- This project uses data on GameStop stores from January 2020 - December 2022, using publicly-available sources online
- There are two data sets being utilized
- Data set 1: Store revenue, transactions, and unit sales data, segmented by transaction date and store number
- Data set 2: Company-wide revenue, transactions, and unit sales data, segmented by transaction date and product category
- Assumption: data sets will be accurate and complete, built by the data engineering team
Scenario:
- Business unit needs some dashboards built
- Little to no direction from stakeholders
My Responsibilities
Step-by-step thinking/methodology as a data analyst:
- Determine key metrics
- Decide how to communicate with visualizations
- Provide ability to investigate further on some metrics (“double-click” metrics)
- Ensure professionalism and accuracy
- Apply company branding if appropriate
Open questions:
- What are we really building?
- What is the purpose, and what is important? (So we don’t build something that’s not useful)
- Do we have the right data available to build what’s important?
- If data not available, try to obtain it rather than just building something that fits the data (doing it the other way around—not useful, leads to tech debt)
- Think like a business owner/product manager—building the right thing, rather than just a thing
Considerations:
- Build what stakeholders need, not what they want
- Careful about not contributing to tech debt
- Anticipate future requirements, future-proof dashboard to a certain degree
- Understanding the business is important—most for-profit businesses care about revenue
- How do we want to report on revenue? Need context and timing
- We have data for three years, probably not too helpful to report on total revenue over those three years
- Annual, quarterly, monthly revenue reporting makes sense
- Weekly data also helpful—don’t need to wait 4 weeks (for monthly data) in order to dive in and analyze, check performance & make corrections, can make quicker business decisions. For example, analyzing ad spend and ROI on ads—probably would like to avoid waiting 4 weeks to see how ads are doing (waste of business resources)
- Daily? May make sense on a smaller scale, but most business metrics don’t require daily scrutinizing
- Hourly? Makes sense for businesses such as restaurants but not at an aggregate corporate level
- Documentation: must be easily accessible outside of the dashboard, easy to update. Referred to in the dashboard. Company wiki or documentation page
What I Did
Proposed deliverables:
- Worksheets for annual, monthly, weekly, daily revenue data
- Store Revenue Summary dashboard
- Products dashboard: different product categories, useful to determine how high-level product categories are performing, and then drill down into specific products. See what is performing well and what isn’t (better marketing needed, more products of a certain category needed, specific products to be removed, etc.)
- Store Sales Performance dashboard: Comparing stores performance against each other and their sales over time. Including business KPIs (average per store) in this dashboard
- Sales Overview (the “why” dashboard): Adding “double click” metrics to this dashboard to answer the question of why the business might be seeing certain trends
Dashboards
Store Revenue Summary

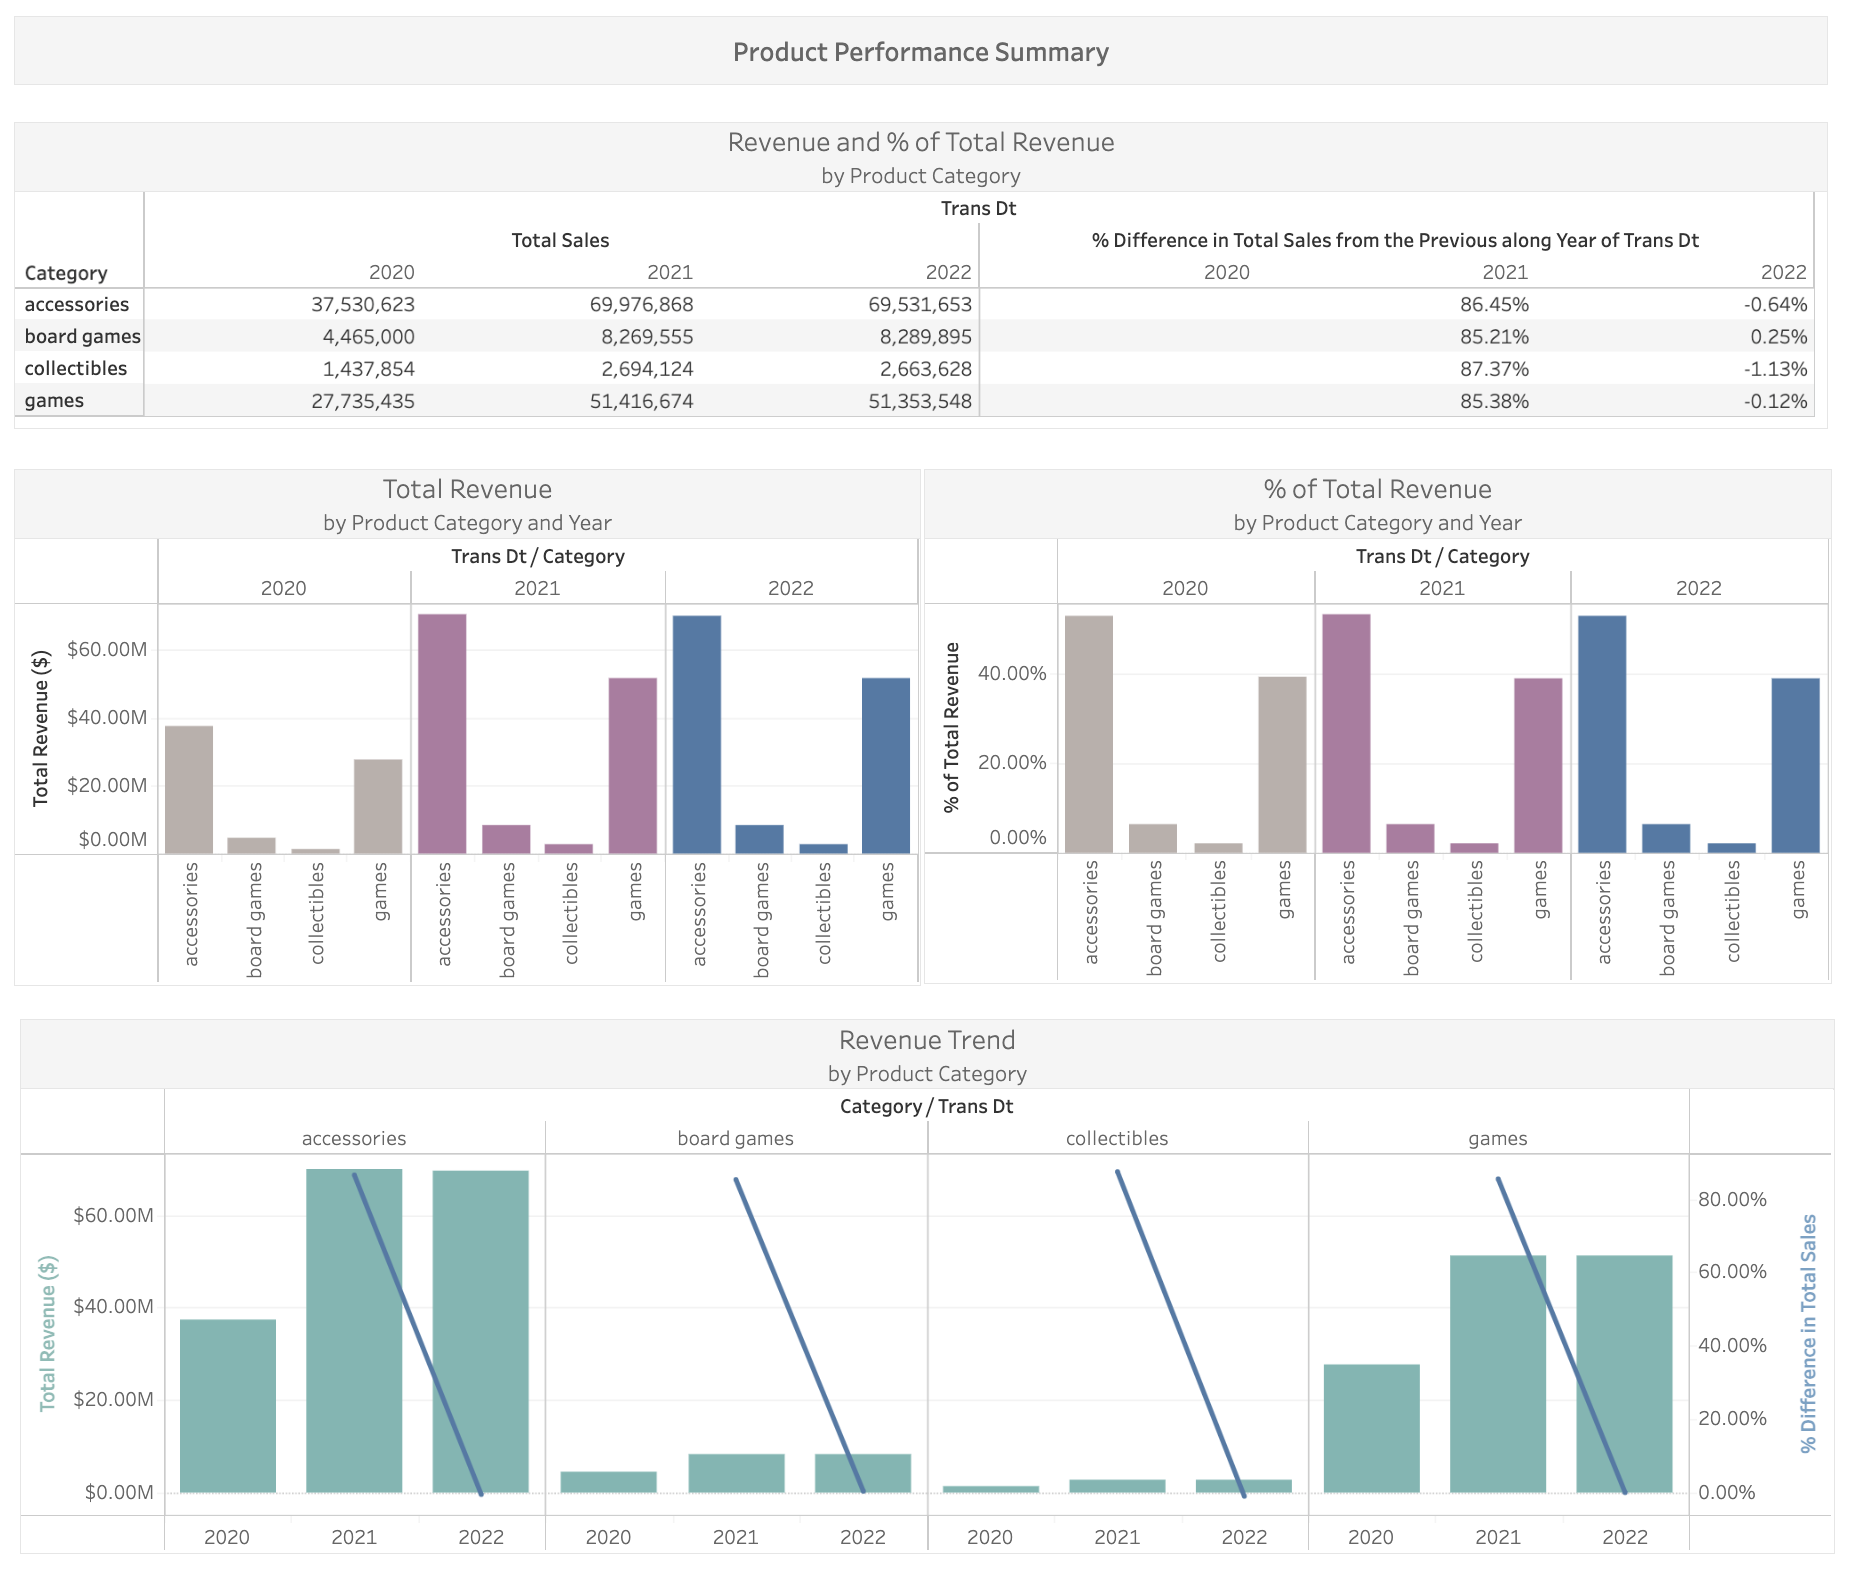
Product Performance Summary
Store Sales Performance Summary

Business KPIs included:
- Average revenue per store
- Average # of transactions per store
- Average # of items sold per store
- Average revenue per transaction
- Average items per transaction
Sales Overview Summary


Results
- The Sales Overview Summary dashboard provides an overall picture of business performance
- It can be seen that the Average Daily Revenue decreased closer to 2022 due to a decrease in the Average Revenue per Transaction
- This can be attributed to a decrease in the Average Revenue per Unit sold, which is shown in the last graph in the dashboard. A suggestion could be for the business to update its pricing, couponing and/or discount policies for each product on the market
- (Note that the Average Revenue per Transaction and Average Units Sold per Transaction graphs do not start at zero—this option was disabled since the range of data values in each graph was too small for any meaningful conclusion)
Dashboard UI/UX considerations:
- Colors don’t need to follow company branding, especially if they are pastels—too distracting, confusing. Red/green colors may be misleading
- Outlining helps understand where a graph or data starts and ends
- Axes titles and labels must reflect data shown in graph
- Axes units and disabling the “start graph at zero” options help understand the data better
- Limiting custom calculations inside of Tableau helps reduce the possibility of bugs and need for constant QA